ReadPlate
Author:
Jose Maria Delfino
(delfino@qb.ffyb.uba.ar)
Department of Biological
Chemistry and Institute of Biochemistry and Biophysics (IQUIFIB)
School of Pharmacy &
Biochemistry, University of Buenos Aires and CONICET
Junin 956, C1113AAD Buenos Aires, Argentina
Phone: 54 11 4962 5506,
extension 116
History:
August 15, 2020: ReadPlate 3.0 version incorporates the capability of
reading multi-well plates
of 6 (3x2), 12 (4x3), 24 (6x4), 48 (8x6) or 96 (12x8)
wells. A new user-friendly interface
facilitates image analysis. This version allows new user-defined
features to optimize blank
correction. Multiple readings of the same plate have also
considerably been facilitated, appending
the full parameter file to the results and log file
February 16, 2018:
ReadPlate2.1 incorporates an improved blank correction algorithm
April 15, 2016: ReadPlate2
introduces a correction for blank measurements
March 10, 2016: Inclusion of
alpha numeric labeling for the wells and calculation
of absorbance values
December 16, 2015: Original
version
With thanks to Sandra Verstraeten, Pablo Carabias,
Irene Mangialavori and Gabriela Gomez for
their enthusiasm, suggestions and help with this project
Key words:
Plate reader, microplate reader, microtiter
plate photometry, absorbance, digital camera, cell-phone
camera
Relevant literature reference:
Carla R. Angelani,
Pablo Carabias, Karen M. Cruz, Jose M. Delfino, Marilina de Sautu,
Maria V. Espelt,
Mariela S. Ferreira-Gomes, Gabriela E. Gomez, Irene
C. Mangialavori,
Malena Manzi, Maria F. Pignataro, Nicolas A. Saffioti, Damiana M. Salvatierra Frechou,
Javier Santos, Pablo J. Schwarzbaum
"A Metabolic Control
Analysis Approach to Introduce the Study of Systems in Biochemistry:
the Glycolytic Pathway in the Red Blood Cell"
Biochemistry and Molecular
Biology Education, Volume 46, Issue5, September/October 2018,
Pages 502-515
https://doi.org/10.1002/bmb.21139
Source:
The source code of
ReadPlate3.0 version is available at
Installation:
Download ReadPlate3.0.txt and
do Plugins > Install. The plugin is ready to be launched by
clicking Plugins >ReadPlate3.0
An example image of a 96-well
plate is available at
Description:
Image acquisition:
The multi-well plate is
located on top of a home-built trans-illuminator: a white 7 x 10 LED array,
powered by a 12V DC power supply, covered with an acrylic
plate that acts as a light-diffusing
base (Figure A).
To avoid the influence of stray light, the device is covered with a tall black
plywood pyramidal box equipped with a central hole at the top
(Figure B), through which the
zoom lens of the camera is located (Nikon CoolPix S6300 in our case, but cell-phone cameras can be
used as well). The vertical optical axis passes through
the center of the plate. To minimize parallax
error that would affect the light path through the samples,
pictures are taken at a minimal distance
of 70 cm. The plate borders should be parallel to the
frame of the picture. The example
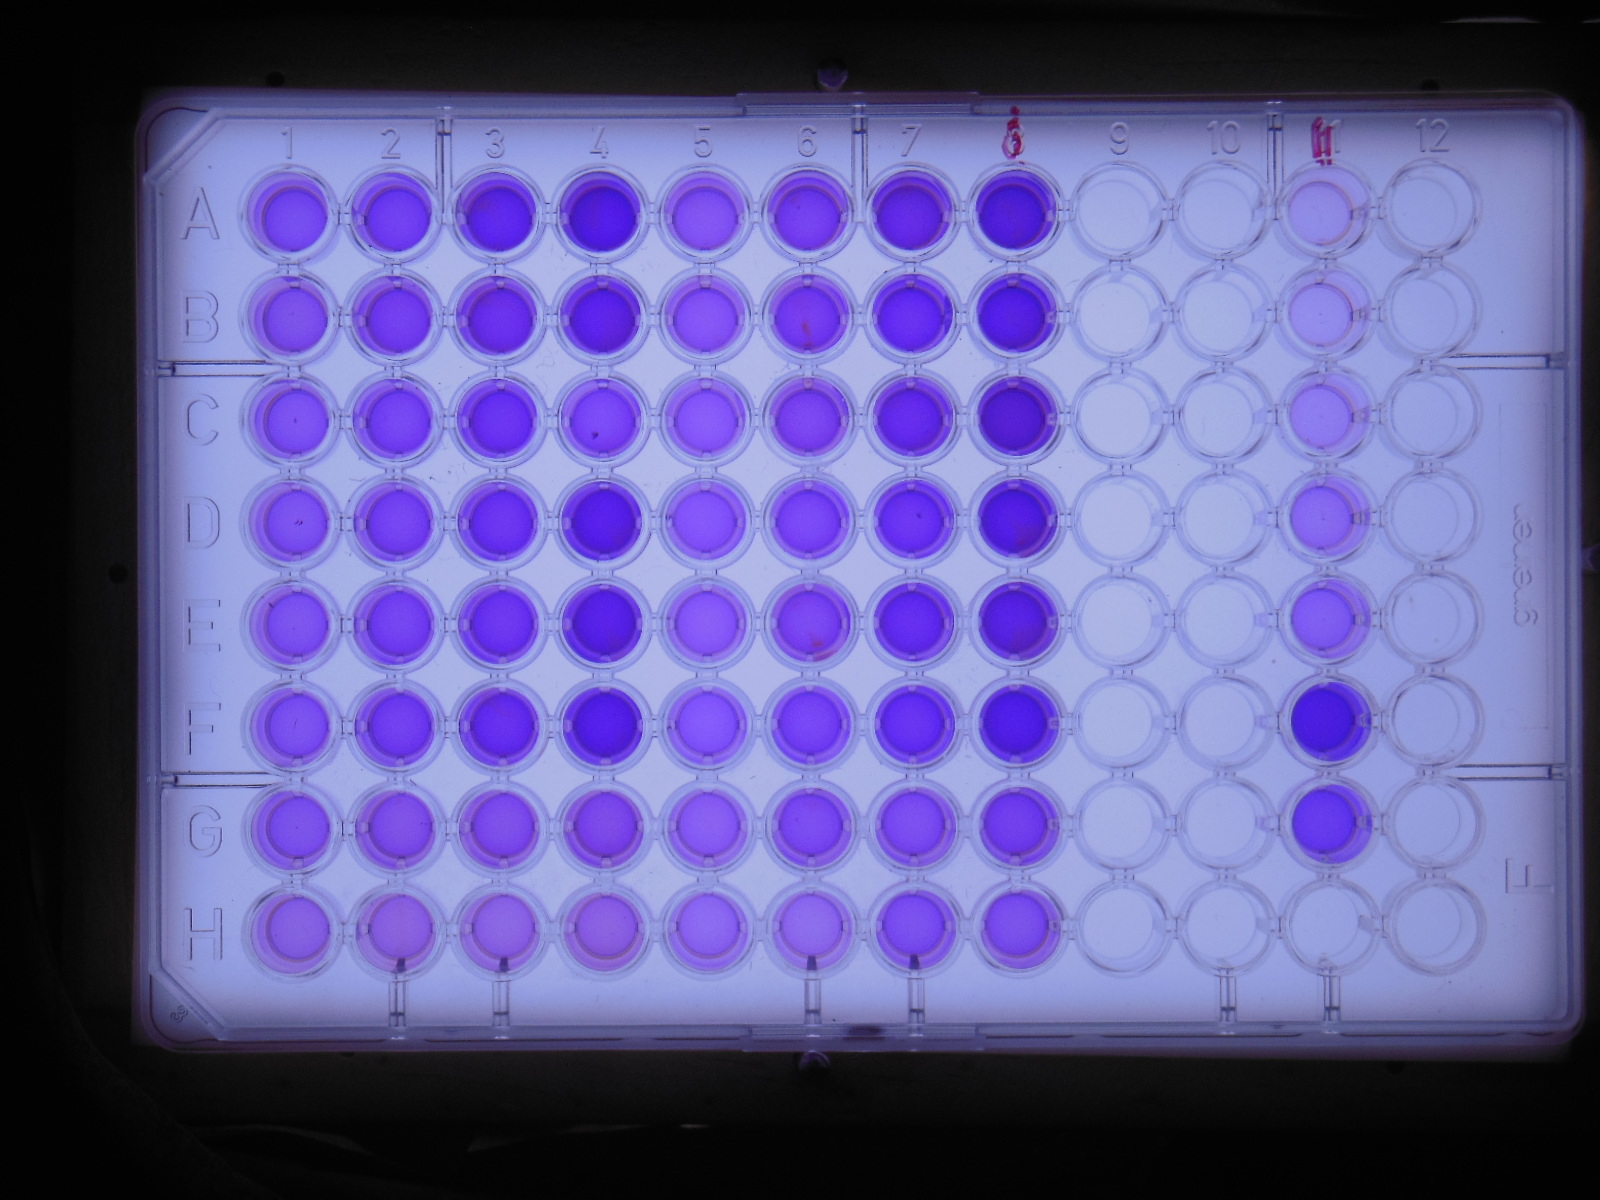
photograph (stored as a .jpg file) corresponds to a 96-well
plate with samples of a colorimetric
assay for lactate (120 μL
per well, maximum of absorbance at 555 nm). In this case, the green
channel shows the highest sensitivity, due to maximal spectral
overlap between the absorption
spectrum of the chromophore in the
sample and the green window.
Plugin use:
Before starting (very
important!), please set the following parameters for measurements:
(Analyze > Set
Measurements). The following should be selected: Area / Standard Deviation /
Min & Max Gray Value/
Mean Gray Value/ Modal Gray Value/ Add to Overlay / Redirect to None /
Decimal Places (0-9): 3. ReadPlate measures the color intensity (RGB) of an image
(.jpg file) of a
multi-well plate of 6 (3x2), 12 (4x3), 24 (6x4), 48 (8x6)
or 96 (12x8) wells. The color photograph
of the plate should be centered at the middle point. For
further details and validation against a
commercial plate reader, see the Supplementary Material (Figure
S3) of the literature reference
cited above. Open the .jpg image from within the ImageJ software (tested with version 1.53c,
Wayne Rasband,
NIH, 26 June 2020). Run the plugin ReadPlate (by
launching Plugins > ReadPlate).
Select the correct plate
format: 6(3x2), 12(4x3), 24(6x4), 48(8x6) or 96(12x8) wells (Figure C).
Make a center-to-center
rectangular selection of wells (upper-left and lower-right corners, Figure D).
Select the desired color
channel (Red, Green, Blue or Gray) for measurements (Figure E). Choose
the appropriate parameters for the grid of circles to be
measured (Figure F). Each circle
needs
not be too large, because enough color information is
coded in pixels covering a relatively small
area. The final grid overlaid on the plate should show main
circles centered on each well surrounded
by ancillary circles located outside (Figure G). The latter are used by the
blank correction
algorithm to compensate for any difference in local light
intensity (Figure H). Check the fit
of the
final grid onto the plate image. If satisfactory, the user
proceeds to collect measurements.
A table of results will
appear next (Figure I). This
includes number, alphanumeric
label and area of each well, light intensity measurements
(Mean, StdDev, Mode, Min, Max),
and absorbance values. Corrected absorbance values (Acorr) result from applying the blank
suppression algorithm. Note that all measurements are taken on a single image of the plate, thus
eliminating the need for taking parallel measurements on an empty
plate.
By default, results are
formatted as .csv files, readily interpretable by
Excel (Figure J).
A - The trans-illuminator

B - The black box and cameras

C - Choosing the plate format

D - Making the rectangular selection

E - Selecting the color channel

F - Setting the parameters

G - Checking the fit of the grid

H - The blank suppression procedure

I - Getting results in tabular form

J - Exporting results in Excel format
